Pages

MIP, my proposal for a high-performance analysis pipeline for whole exome sequencing

Saturday, August 23, 2014


Hi all,

It has been a while since my last post, but the reason is worth the long time absent. Since January I am co-leading the bioinformatics and I.T department of one of Genomika Diagnósticos

Genomika is one of most advanced clinical genetics laboratory in Brazil. Located in Recife, Pernambuco, in the Northeast of Brazil, it provides cutting edge molecular testing in cancer samples to better define treatment options and prognosis, making personalized cancer management a reality. It also has a vast menu of tests to evaluate inherited diseases, including cancer susceptibility syndromes and  rare disorders. Equipped with state-of-the-art next-generation sequencing instruments and a world-class team of specialists in the field of genetic testing, Genomika focus on test methods that improve patient care and have immediate impact on management.  There is available a pitch video about our lab and one of our exams (unfortunately the spoken language is portuguese).

Our video about sequencing exams spoken in portuguese

My daily work is to provide tools; infra-structure and systems to support our clients and teams in the lab. One of major teams is the molecular biology sector. It is responsible for the DNA sequencing exams, which includes targeted-panels, specific genes or exons or whole exome.  Each one of those genetic tests, before delivered to the patient and the doctor,  goes under several data pre-processing and analysis steps organised in a ordered set of sequential steps, which we call a pipeline.

There is a customised pipeline for clinical sequencing; where we bioinformaticians and specialists study the genetic basis of human phenotypes. In our lab pipeline we are interested on selecting and capturing the protein-coding portion of the genome (we call the exome).  This region responsible for only 3% of our human DNA can be used to elucidate the genetic causes of many human diseases, starting from single gene disorders and moving on more complex genetic disorders, including complex traits and cancer.

Clinical Sequencing Pipeline overview


For this task,  we use several tools that must handle with large volumes of data, specially because of the new next-generation DNA sequencing machines (yeah we have one at our lab from Illumina). Those machines are capable of producing in shorter times and lower costs  large amount of NGS data. 

Taking those challenges into account, we perform our sequencing, alignment, detection and data analysis of human samples in order to seek variants.  This study we call variant analysis. Variant analysis looks for variant information, that is, possible mutations that may be associated to genetic diseases . Let's consider as examples of mutation or variant as follows: a change of nucleotide (A for T) (single nucleotide variant or SNV) or even a small insertion or deletion (INDEL's) that can impact the functional activity of the protein.  Looking after variants and even further seek and identify those related to diseases or genetic disorders is a big challenge in terms of technology, tools and interpretation.
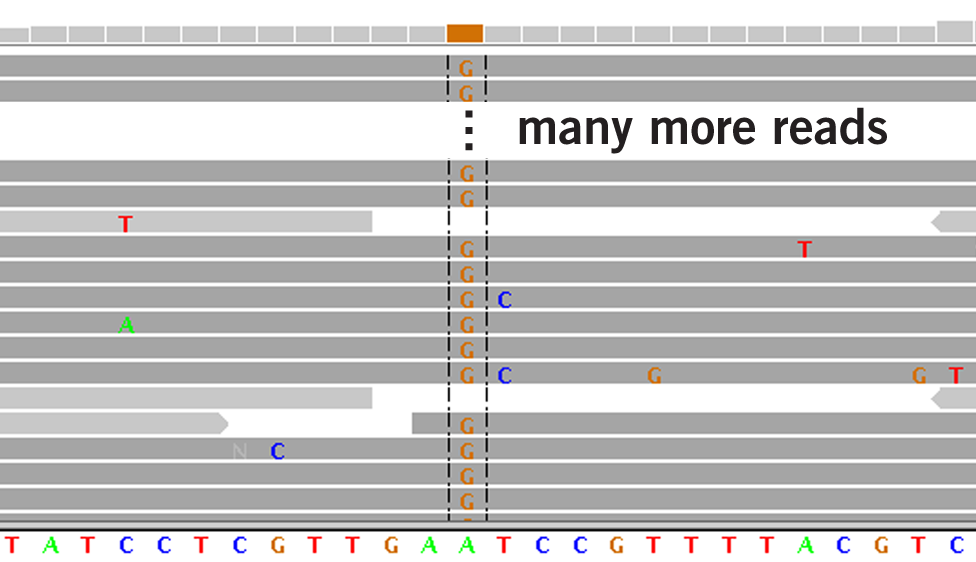
The reference in the genome at bottom; the variants above.
In this example there's a possible exchange of A to G (SNV) in a specific position of the genome.


In our lab we are developing a streamlined, highly automated pipeline for exome and targeted panel regions data analysis. In our pipeline we handle multiple datasets and state of the art tools that are integrated in a custom pipeline for generating, annotating and analyzing sequence variants.

We named our internal pipeline tool as MIP (Mutation Identification pipeline). Some minimal requirements we stablished for MIP in order to use it with maximum performance and productivity. 

1. It must be automatic;  with a limited team like ours (2 or 3 bioinformaticians) we need a efficient service that is capable to execute the complete analysis without typing commands at terminals calling software or converting files among several data formats.

MIP pipeline overview for clinical sequencing. All those steps requires tools and files in a specific format.
Our engine   would be capable of manage and execute all or some of those steps with
specific parameters defined by the specialist .

2. It must be user-oriented; it mean that MIP platform must provide an easy-to-use interface, that any researcher of lab could use the system and start out-of-box their sequencing analysis.  For biologists and geneticists it would allow them to focus their work on what matters: the downstream experiments.

3. Scalable-out architecture;  More and more hight throughput sequencing data is pulled out from NGS instruments, so MIP must be designed to be a building block for a scalable genomics infrastructure. It means that we must work with distributed and parallel approaches and the best practices from high-performance computing and big data to efficient take advantage of all resources available at our infra-structure while thinking on continuous optimization in order to minimize the network and shared disk I/O footprint.

My draft proposal to our exome sequencing pipeline

4. Rich-detailed reports and smart software and dataset updates;  In order to maintain our execution engine working healthy, it requires that our software stack always being updated. Since our engine is written on top of numerous open-source biological and big data packages, we need a self-contained management system that could not only check for any new versions but also with a few clicks start any update and perform a post-check for any possible corruptions at the pipeline.  In addition to the third-party genomics software used on MIP, we are also developing our tool for variant annotation. So it stands for an engine that could query and analyze several genomic dataset, generate real-time interactive reports where the researchers could filter out variants based on specific criteria and output in formats of QC reports, target and sequencing depth information, descriptions of the annotations and variants hyperlinked to public datasets in order to get further details about a variation.

Example of web interface where a researcher could select any single or combination of annotations to display. Links to the original datasources are readily available (Figure from WEP annotation system)

5. Finally, we think the most important requirement nowadays to MIP is the integration with our current LMS (Laboratory management system), in order to put the filtered variants  as input to our existing laboratory report analysis and publishing workflow. It means more productivity and automation with our existing infrastructure.

MIP could be also be acessible via RESful API, where the runs output
 would be interchanged with our external LMS solution.

As you may see, there's a huge effort on coding, design and infrastructure to meet those requirements. But we are thrilled to make this happen!  One of our current works in this project is the genv tool. Genv is what we call our genomika environment builder. The basic idea behind it is a tool written in python and fabric package, that provides instant access to biological software, programming libraries and data. The expected result  is a fully automated infrastructure that installs all software and data required to start MIP pipeline.  We are thinking of also arranging pre-built images with Docker.  Of course I will need a whole post to explain more about it!

To sum up,  I hope I could summarise one of the projects I've been working this first semester. At Genomika Diagnósticos we are facing big scientific challenges and the best part is that those tools are helping our lab to provide a next level of health information to the patients,  all from our DNA!

If you are interested on working with us, keep checking our github homepage with any open positions at our bioinformatics team.

Until next time!

New year, new work and new posts about Bioinformatics, NGS sequencing e Machine learning!

Friday, March 21, 2014


Hi all,

It has been a while since my last post at the blog. No, I didn't abandon the blog! It has happened many events at my life since november that I decided to pause a bit my posts marathon and started to organize my work life! The best news this year is that I am now facing new challenges on machine learning, data mining, big data and now on: bioinformatics!! That's right.  I am now CTO of Genomika Diagnósticos, a brazilian genetics laboratory at Recife, Pernambuco.  The laboratory combines the state-of-art genetic testing with comprehensive interpretation of test results by specialists, geneticists to provide clinically relevant molecular tests for a variety of genetic disorders and risk factors.


My work there now is work with NGS (next-gen sequencing) tools to support the exome and genome sequencing to analyse genes and exons in panels to detect any significant genetic variations, which are candidates to cause the patient's phenotype. There are a lot of work to do, so in the next weeks I will post some tutorials about bioinformatics, machine learning, parallelism and big data applied on genoma sequencing.

This field is a novel study field and there are many applications related to disease detection, prevention, and treatment. Could you imagine that sequencing DNA would cost more than $10,000 dollars in 2001 and it has been decreasing exponentially the cost of the procedure.


My next posts will talk about how DNA sequencing works and how machine learning and data ming can be applied in this exciting and promising field!

Regards,

Marcel Caraciolo


Review new book: Practical Data Analysis

Tuesday, November 26, 2013


Hi all,

I was invited by the Packtpub team to review the book Practical Data Analysis by Hector Cuesta.  I started reading it for the last two weeks and I really enjoyed the topics approach covered by the book.


The book goes through the data science hot topics by presenting several practical examples of data exploration, analysis and even some machine learning techniques. Python as the main platform for the sample codes was a perfect choice, at my opinion. Since Python has becoming more popular at scientific community. 

The book brings several examples in  several science study fields such as stock prices, sentiment analysis on social networks,  biology modelling scenarios, social graphs,  MapReduce, text classification,  data visualisation, etc.  Many novel libraries and tools are presented including Numpy, Scipy, PIL, Python, Pandas, NLTK, IPython, Wakari ( I really liked a dedicated chapter for this excellent tool for scientific python environment on-line),  etc.  It also covers NoSQL databases such as MongoDB and visualisation libraries like D3.js.

I believe the biggest value proposition of this book is that it brings together in one book several tools and how they can be applied on data science. Many tools mentioned lacks further examples or documentation, which this book can assist any data scientist on this task.

However, the reader must not expect learn machine learning and data science in this book.  The theory is  scarce, and I believe it was not the main goal of the author for this book. For anyone looking to learn data science, this is not the right book. It is focused on who desires an extra resource for sample codes and inspirations, it will be a great pick!

The source code is available on Github, but you can explore them better explained inside the book, including illustrations. To sum up, I have to congratulate Hector for his effort writing this book. For the Scientific community, including the Python group, they will really enjoy this book! I really missed more material about scientific stack software installations, since for the beginners it can be really painful.  But in overall, it was well written focused on practical problems! A guide for any scientists.

For me the best chapters were the Chapter 6: Simulation of Stock Prices, the visualisation using D3.js was great, and the last chapter, 14, about On-line Data Analysis with IPython and Wakari. It's the first time I see Wakari covered in a book! Everyone who works with scientific Python today must give a chance some day to experiment this on-line tool! It's awesome!

Congratulations to PacktPub and Hector for the book!

Regards,

Marcel Caraciolo

Non-Personalized Recommender systems with Pandas and Python

Tuesday, October 22, 2013


Hi all,

At the last PythonBrasil I gave a tutorial about Python and Data Analysis focused on recommender systems, the main topic I've been studying for the last years. There is a popular python package among the statisticians and data scientists called Pandas. I watched several talks and keynotes about it, but I didn't have a try on it. The tutorial gave me this chance and after the tutorial me and the audience fell quite excited about the potential and power that this library gives.

This post starts a series of articles that I will write about recommender systems and even the introduction for the new-old refreshed library that I am working on:  Crab,  a python library for building recommender systems. :)

This post starts with the first topic about the theme: Non-personalized Recommender Systems and giving several examples with the python package Pandas.  In future I will also post an alternative version of this post but referencing Crab, about how it works with him.

But first let's introduce what Pandas is.

Introduction to Pandas


Pandas is a data analysis library for Python that is great for data preparation, joining and ultimately generating well-formed, tabular data that's easy to use in a variety of visualization tools or (as we will see here) machine learning applications. For further introduction about pandas, check this website or this notebook.

Non-personalized Recommenders


Non-personalized recommenders can  recommend items to consumers based on what other consumers have said about the items on average. That is, the recommendations are independent of the customer,  so each customer gets the same recommendation.  For example, if you go to amazon.com as an anonymous user it shows items that are currently viewed by other members.

Generally the recommendations come in two flavours: predictions or recommendations. In case of predictions are simple statements that are formed in form of scores, stars or counts.  On the other hand, recommendations are generally simple a list of items shown without any number associated with it.

Let's going by an example:

Simple Prediction using Average

The score in the scale of 1 to 5 to the book Programming Collective Intelligence was 4.5 stars out of 5.
This is an example of a simple prediction. It displays a simple average of other customer reviews about the book.
The math behind it is quite simple:

Score = ( 65 * 5 + 18 * 4 + 7 * 3 +  4 * 2 +  2 * 1)
Score =  428/ 96
Score = 4.45 ˜= 4.5 out of 5 stars

In the same page it also displays the information about the other books which the customers bought after buying Programming Collective Intelligence. A list of recommended books presented to anyone who visits the product's page. It is an example of recommendation.


But how Amazon came up with those recommendations ? There are several techniques that could be applied to provide those recommendations. One would be the association rules mining, a data mining technique to generate a set of  rules and combinatios of items that were bought together. Or it could be a simple average measure based on the proportion of who bought x and y by who bought x. Let's explain using some maths:


Let X be the number of customers who purchased the book Programming Collective Intelligence. Let Y be the other books they purchased. You need to compute the ration given below for each book and sort them by descending order.  Finally, pick up the top K books and show them as related. :D

Score(X, Y) =  Total Customers who purchased X and Y / Total Customers who purchased X


Using this simple score function for all the books you wil achieve:


Python for Data Analysis                                                 100%

Startup Playbook                                                              100%

MongoDB Definitive Guid                                                0 %

Machine Learning for Hackers                                          0%


As we imagined the book  Python for Data Analysis makes perfect sense. But why did the book  Startup Playbook came to the top when it has been purchased by customers who have not purchased Programming Collective Intelligence.  This a famous trick in e-commerce applications called banana trap.   Let's explain: In a grocery store most of customers will buy bananas. If someones buys a razor and a banana then you cannot tell that the purchase of a razor influenced the purchase of banana.  Hence we need to adjust the math to handle this case as well. Modfying the version:

Score(X, Y) =  (Total Customers who purchased X and Y / Total Customers who purchased X) / 
         (Total Customers who did not purchase X but got Y / Total Customers who did not purchase X)

Substituting the number we get:

Python for Data Analysis =   ( 2 / 2 ) /  ( 1 / 3) =  1 / 1/3  =  3 

Startup Playbook   =   ( 2 / 2)  /  ( 3 /  3)  =  1 

The denominator acts as a normalizer and you can see that Python for Data Analysis clearly stands out.  Interesting, doesn't ? 

The next article I will work more with non-personalized recommenders, presenting some ranking algorithms that I developed for Atepassar.com for ranking  professors. :)

Examples with real dataset (let's play with CourseTalk dataset)

To present non-personalized recommenders let's play with some data. I decided to crawl the data from the popular ranking site for MOOC's  Course Talk.  It is an aggregator of several MOOC's where people can rate the courses and write reviews.  The dataset is a mirror from the date  10/11/2013 and it is only used here for study purposes.


Let's use Pandas to read all the data and start showing what we can do with Python and present a list of top courses ranked by some non-personalized metrics :)

Update: For better analysis I hosted all the code provided at the IPython Notebook at the following link by using nbviewer.

All the dataset and source code will be provided at crab's github, the idea is to work on those notebooks to provide a future book about recommender systems :)

I hope you enjoyed this article,  and stay tunned for the next one about another type of non-personalized recommenders:  Ranking algorithms for vote up/vote down systems!

Special thanks for the tutorial of Diego Manillof :)

Cheers,

Marcel Caraciolo

Ruby in the world of Recommendations (also machine learning, statistics and visualizations)

Tuesday, September 17, 2013

Hello everyone!

I am back with lots of news and articles! I've been quite busy but I returned. In this post I'd like to share my last presentation that I gave at Frevo On'Rails Pernambuco Ruby Meeting at Recife, PE. My  Ruby developer colleagues around Recife invited me to give a lecture there.  I was quite excited about the invitation and instanlty I accepted.

I decided to research more about scientific computing with Ruby and recommender libraries written focused on Ruby either.  Unfortunately the escossistem for scientific environment in Ruby is still at very beginning.  I found several libraries but most of them were abandoned by their developers or commiters.  But I didn't give up and decided to refine my searches. I found a espectular and promising work on scientific computing with ruby called SciRuby. The goal is to por several matrix and vector representations with Ruby using C and C++ at backend. It remembered me a lot the beginnings of the library Numpy and Scipy :)

About the recommenders, I didn't find any deep work as Mahout, but I found a library called Recommendable that uses memory-based collaborative filtering.  I really liked the design of the library and the workaround of the developer on making the linear algebra operations with Redis instead of Ruby :D

All those considerations and more insights I put on my slides, feel free to share :)


I hope you enjoyed, and even I love Python, I really like programming another languages :)


Regards,

Marcel

Slides and Video from my talk about Big Data with Python in Portuguese

Thursday, July 4, 2013


Hi all,

It has been a while since my last technical posts. But it's for a great cause! I am writing the current book about recommender systems and it is taking some dedicated time to work on it! But great posts are coming to the blog.

I'd like to publish an on-line talk that I gave in June' 18 at #MutiraoPython, a great initiative that I started with my startup PyCursos, an learning school for teaching Python and applications on-line. It's like a Coursera MOOC's for Programming in portuguese!  This talk was part of a series of keynotes that are happening every week on-line for free using the Hangout on Air!


I gave a lecture for about two hours about Big Data with Python and presentend some tools used for data analysis. I know that I missed to explore more Pandas, Ipython, Scikit-learn. However, I decided to explore the Hadoop Architecture and MapReduce Paradigm and some code examples with Python.

It's in portuguese! But all the content is available for free! I hope you enjoy!

Video and code


Review about the book Learning IPython for Interactive Computing and Data Visualization

Monday, June 17, 2013


Hi all,

I was invited to review a copy of the book recently released titled "Learning IPython for Interactive Computing and Data Visualization" by the author Cyrille Rossant.  The book focus on one of the best tools for working with Python with the interactive incremented shell IPython.  By the way, it was the time to the tool receive a special book about it.


Learning IPython for Interactive Computing and Data Visualization

IPython is covered through the six chapters using several basic examples related to scientific computing  along with another Python tools such as Matplotlib, Numpy, Pandas, etc.  The first chapters explore the IPython basics such as installation, basic commands to get used with the tool.

The next chapters introduces NumPy and Pandas basics with the IPython shell active. Don't expect advanced examples with those tools. The idea is a simple demonstration of what we can do at IPython.

There is a chapter to discuss the visualization data with graphs, plottings with IPython Notebook. However I missed more details abot IPython notebook. It lacks more deep examples related to the topic.  

I really liked the chapter 5 when they showed some basics of MPI (Message Passing Theme), although the topic wasn't vasted explored. But the introduction gives a greate potential of usefulness to the more advanced books about IPython.

The last chapter shows how to create pluggins to IPython, for instance, create an simple extension that introduces a new cell magic (write C++ code directly in the cell, and it will be automatically compiled and executed).

My conclusion about the book is that it achieves the expected goal: a technical introduction to IPython. If you want a book to explore scientific computing or a advanced stuff to IPython, this is not the the book yet. I can say that this book is a first start for much more topics about the use of IPython.  MPI, IPython notebook, etc.  I recommend the book for start exploring the IPython as reference! :D


Regards,

Marcel

Review of the book Learning Scipy for Numerical and Scientific Computing

Monday, April 15, 2013


Hi all,

I've finished reading the book "Learning Scipy for Numerical and Scientific Computing".  This book comes to the scientific python series that PacktPub are bringing to the Python Developers! Congratulations!  As the title informs: it includes Scipy, Numpy and Matplotlib.  I only missed some further information about IPython, but it wasn't the goal of the book, so it goes well even leaved out.


It covers several important topics that are not as commonly covered, specially with several snippets illustrating special functions presented at Scipy library. For the developers it will be another great reference book to complement the native docs that comes with the library.  I enjoyed the author focused more on numerical analysis functions, it is one of the most used functions at the library.  

The bool also brings chapters on more specific applications: signal processing, data mining and computational geometry.  There is an extra chapter about the integration with another languages, but I found it not dense enough to explain those integrations. I really missed more start-off examples showing how to install the f2py or how to use Scipy with C/C++. 

Overall the Learning Scipy for Numerical and Scientific Computing book is a good book on Scipy covering  lots of mathematics with examples in Python. The book has a good size and it helps the scientists and scientific developers (by the way the non-developers will face some difficulties due to the heavy math that comes with the examples) to have a good overview on the library before exploring the reference material.


Thanks Kenny for the invitation to review this book, and congratulations to Francisco for bringing one more technical book for scientific python computing to the series!

Regards,

Marcel Caraciolo


Slides for Scientific Computing Meeting: Benchy and GeoMapper Visualization

Sunday, April 7, 2013


Hi all,

Yesterday it happened the XXVI local meeting of the Python Users Group at Pernambuco (PUG-PE).  In the occasion I had the opportunity to present two talks about scientific computing with python.


The first one was the lightweight framework for benchmark analysis on Python Scripts called Benchy, which I developed for about one week to help me on checking performance of several algorithms that I developed in Python.  I covered the framework at my last post which can be found here.


Here are the slides for the presentation:


The second talk was about a new type of visualization that I developed for social network analysis in order to check the degree of connections between the users at the socialnetwork using their geolocation data to present in a map.

The result was beautiful plots using this new type of visualization.  Amazing!

The slides are available here:


I hope you enjoy the slides, any further information feel free to comment!

Regards,

Marcel Caraciolo

Performing runtime benchmarks with Python Monitoring Tool Benchy

Friday, March 22, 2013


Hi all,

I've been working on in the last weeks at a little project that I developed called benchy.  The goal of benchy is answer some trivial questions about which code is faster ?  Or which algorithm consumes more memory ?  I know that there are several tools suitable for this task, but I would like to create some performance reports  by myself using Python.   

Why did I create it ?  Since the beginning of the year I decided to rewrite all the code at Crab, a python framework for building recommender systems.  And one of the main components that required some refactoring was the pairwise metrics such as cosine, pearson, euclidean, etc.  I needed to unit test the performance of several versions of code for those functions. But doing this manually ? It's boring. That's why benchy came for!


What benchy can do ?

Benchy is a lightweight Python library for running performance benchmarks over alternative versions of code.  How can we use it ?

Let's see the cosine function, a popular pairwise function for comparing the similarity between two vectors and matrices in recommender systems.


Let's define the benchmarks to test:


With all benchmarks created, we could test a simple benchmark by calling the method run:


The dict associated to the key memory represents the memory performance results. It gives you the number of calls repeat to the statement, the average consumption usage in units . In addition, the key 'runtime' indicates the runtime performance in timing results. It presents the number of calls repeat following the average time to execute it timing in units.

Do you want see a more presentable output ? It is possible calling the method to_rst with the results as parameter:


Benchmark setup
import numpy
X = numpy.random.uniform(1,5,(1000,))

import scipy.spatial.distance as ssd
X = X.reshape(-1,1)
def cosine_distances(X, Y):
    return 1. - ssd.cdist(X, Y, 'cosine')
Benchmark statement
cosine_distances(X, X)
namerepeattimingloopsunits
scipy.spatial 0.8.0318.3610ms


Now let's check which one is faster and which one consumes less memory. Let's create a BenchmarkSuite. It is referred as a container for benchmarks.:

Finally, let's run all the benchmarks together with the BenchmarkRunner. This class can load all the benchmarks from the suite and run each individual analysis and print out interesting reports:


Next, we will plot the relative timings. It is important to measure how faster the other benchmarks are compared to reference one. By calling the method plot_relative:


As you can see the graph aboe the scipy.spatial.distance function is 2129x slower and the sklearn approach is 19x. The best one is the numpy approach. Let's see the absolute timings. Just call the method plot_absolute:


You may notice besides the bar representing the timings, the line plot representing the memory consumption for each statement. The one who consumes the less memory is the nltk.cluster approach!

Finally, benchy also provides a full repport for all benchmarks by calling the method to_rst:


Performance Benchmarks

These historical benchmark graphs were produced with benchy.
Produced on a machine with
  • Intel Core i5 950 processor
  • Mac Os 10.6
  • Python 2.6.5 64-bit
  • NumPy 1.6.1

scipy.spatial 0.8.0

Benchmark setup
import numpy
X = numpy.random.uniform(1,5,(1000,))

import scipy.spatial.distance as ssd
X = X.reshape(-1,1)
def cosine_distances(X, Y):
    return 1. - ssd.cdist(X, Y, 'cosine')
Benchmark statement
cosine_distances(X, X)
namerepeattimingloopsunits
scipy.spatial 0.8.0319.1910ms

sklearn 0.13.1

Benchmark setup
import numpy
X = numpy.random.uniform(1,5,(1000,))

from sklearn.metrics.pairwise import cosine_similarity as cosine_distances
Benchmark statement
cosine_distances(X, X)
namerepeattimingloopsunits
sklearn 0.13.130.18121000ms

nltk.cluster

Benchmark setup
import numpy
X = numpy.random.uniform(1,5,(1000,))

from nltk import cluster
def cosine_distances(X, Y):
    return 1. - cluster.util.cosine_distance(X, Y)
Benchmark statement
cosine_distances(X, X)
namerepeattimingloopsunits
nltk.cluster30.010241e+04ms

numpy

Benchmark setup
import numpy
X = numpy.random.uniform(1,5,(1000,))

import numpy, math
def cosine_distances(X, Y):
    return 1. -  numpy.dot(X, Y) / (math.sqrt(numpy.dot(X, X)) *
                                     math.sqrt(numpy.dot(Y, Y)))
Benchmark statement
cosine_distances(X, X)
namerepeattimingloopsunits
numpy30.0093391e+05ms

Final Results

namerepeattimingloopsunitstimeBaselines
scipy.spatial 0.8.0319.1910ms2055
sklearn 0.13.130.18121000ms19.41
nltk.cluster30.010241e+04ms1.097
numpy30.0093391e+05ms1

Final code!

I might say this micro-project is still a prototype, however  I tried to build it to be easily extensible. I have several ideas to extend it, but feel free to fork it and send suggestions and bug fixes.  This project was inspired by the open-source project vbench, a framework for performance benchmarks over your source repository's history. I recommend!

For me, benchy will assist me to test several pairwise alternative functions in Crab. :)  Soon I will publish the performance results that we got with the pairwise functions that we built for Crab :)

I hope you enjoyed,

Regards,

Marcel Caraciolo